12 KiB
12 KiB
Preamble ignore
General comments ignore
Specific comments for this manuscript ignore
org specific settings ignore
Latex header ignore
Latex macros ignore
Authors and affiliations ignore
Buffer-wide source code blocks ignore
# # #
End preamble ignore
The poster
Code ignore
Left column BMCOL
Background B_block
- Here we show how org-mode (version ) and emacs (version
org-version) can be used to make decent looking scientific postersemacs-version - With org-mode we can populate the poster with code, graphs and numbers from inline code in languages such as R, python, Matlab and even shell scripting
- For example, this poster was created on on
.
lsb_release -sd} {{{results(Ubuntu 17.10)}} - Inline code could look like this (which will produce a graph; Fig. /emacs/org-mode-poster/src/commit/795f8708f2acf732701223e14337033a8051c6c4/src/figcode1):
Block
set.seed(20180402)
x1 <- rnorm(100, 0, 1)
x2 <- rnorm(100, 0.5, 1)
hist(x1, col="red")
hist(x2, col="blue", add=TRUE)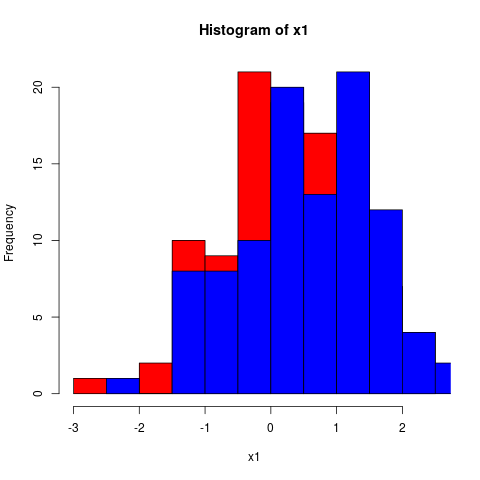
Inline code and tables B_block
- Tables are powerful in org-mode and even include spreadsheet capabilities
- Some code to process the first vector from above to make a table out of its summary could look like this, which would result in a little table (Table /emacs/org-mode-poster/src/commit/795f8708f2acf732701223e14337033a8051c6c4/src/tabcode2) :
Block
library(broom)
library(dplyr)
t1 <- tidy(round(summary(x1), 2))
t2 <- tidy(round(summary(x2), 2))

# This will export as a table
rbind(t1, t2) %>%
mutate(name=c("x1", "x2"))
\vspace{2cm} \small
| minimum | q1 | median | mean | q3 | maximum | name |
| -2.29 | -0.49 | 0.11 | 0.14 | 0.8 | 2.47 | x1 |
| -2.17 | -0.45 | 0.07 | 0.13 | 0.85 | 2.23 | x2 |
Right column BMCOL
Graphics B_block
- We can use shell scripting to grab an image with curl from the internet (Fig. /emacs/org-mode-poster/src/commit/795f8708f2acf732701223e14337033a8051c6c4/src/figcode3):
Block
\footnotesize
# Download emacs icon from gnu.org
curl -0 https://www.gnu.org/software/emacs/images/emacs.png
\normalsize
\vspace{2cm}

Math B_block
- Let's describe how to compute the distance between the two simulated distributions $x1$ and $x2$ from before:
Block
\small The Kullback-Leibler (KL) divergence measures the difference between two probability distributions (i.e., the loss of information when one distribution is used to approximate another). The KL divergence is thus defined as #
\begin{align} \label{eq:KL} \DKLPQ{P}{Q}{\|} = \sumin \Xoi{P} \log \frakPQ{P}{Q} \end{align}# with $P$ and $Q$ being two probability distribution functions and $n$ the number of sample points. Since $\DKLPQ{P}{Q}{\|}$ is not equal to $\DKLPQ{Q}{P}{\|}$, a symmetric variation of the KL divergence can be derived as follows: # \small
\begin{align} \label{eq:KL2} \DKLPQ{P}{Q}{,} = \sumin \Big(\Xoi{P} \log \frakPQ{P}{Q} + \Xoi{Q} \log \frakPQ{Q}{P} \Big). \end{align}Columns B_block
Left
∩tionsetup{justification=justified,width=.85\linewidth}
Right
∩tionsetup{justification=justified,width=.85\linewidth}
Conclusions B_block
- This example is meant to show how versatile org-mode is
- Scientific posters can be produced with a simple text editor