11 KiB
11 KiB
Preamble ignore
General comments ignore
Specific comments for this manuscript ignore
org specific settings ignore
Latex header ignore
Authors and affiliations ignore
Buffer-wide source code blocks ignore
# # #
End preamble ignore
The poster
Code ignore
Left column BMCOL
Background B_block
- Here we show how org-mode (version ) together with emacs (version
org-version) can be used to make decent looking scientific postersemacs-version} {{{results(25.2.2)}} - With org-mode we can populate the poster with code, graphs and numbers from inline code in languages such as R, python, Matlab and even shell scripting
- For example, this poster was created on
- Inline code could look like this (which will produce a graph; Fig. /emacs/org-mode-poster/src/commit/63176e438215fa992d1f554d4569bc3419816ca9/src/figcode1):
Block
set.seed(20180402)
x1 <- rnorm(100, 0, 1)
x2 <- rnorm(100, 0.5, 1)
hist(x1, col="red")
hist(x2, col="blue", add=TRUE)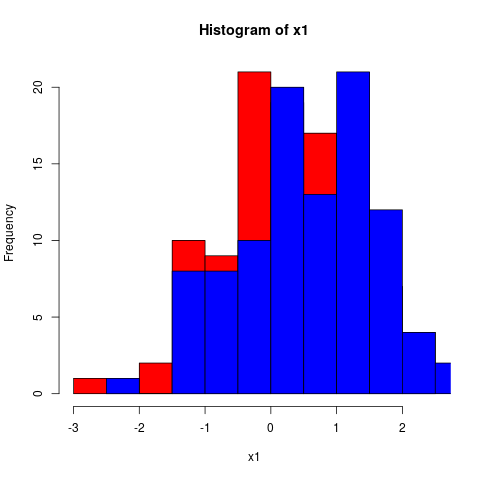
Inline code and tables B_block
- In addition to inline code, we can also produce tables
- Tables are very powerful in org-mode, they even include spreadsheet capabilities
- Some code to process the first vector from above to make a table out of its summary could look like this, which would result in a little table (Table /emacs/org-mode-poster/src/commit/63176e438215fa992d1f554d4569bc3419816ca9/src/tabcode2) :
Block
library(broom)
library(dplyr)
t1 <- tidy(round(summary(x1), 2))
t2 <- tidy(round(summary(x2), 2))

# This will export as a table
rbind(t1, t2) %>%
mutate(name=c("x1", "x2"))
\vspace{2cm}
| minimum | q1 | median | mean | q3 | maximum | name |
| -2.29 | -0.49 | 0.11 | 0.14 | 0.8 | 2.47 | x1 |
| -2.17 | -0.45 | 0.07 | 0.13 | 0.85 | 2.23 | x2 |
Right column BMCOL
Graphics B_block
- We can use shell scripting to grab an image with curl from the internet (Fig. /emacs/org-mode-poster/src/commit/63176e438215fa992d1f554d4569bc3419816ca9/src/figcode3):
Block
\footnotesize
# Download emacs icon from gnu.org
curl -0 https://www.gnu.org/software/emacs/images/emacs.png
\normalsize
\vspace{2cm}

Math B_block
- We can easily include math
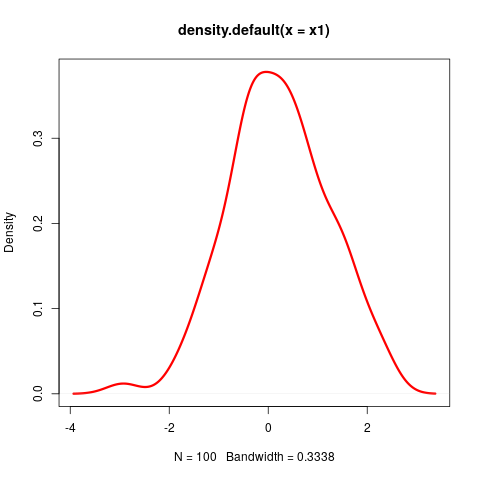
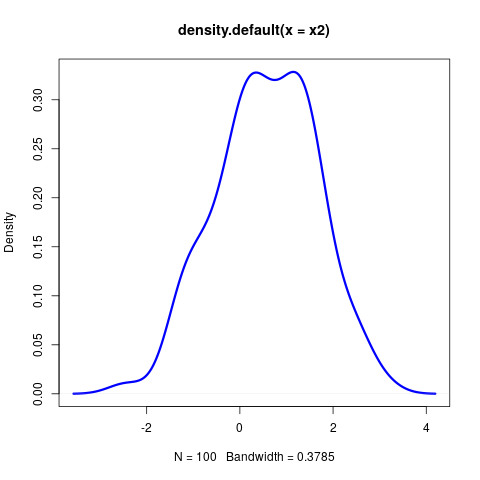
- For example, let's describe how to compute the distance between the two simulated distributions $x1$ and $x2$ from before:
Block
The Kullback-Leibler (KL) divergence measures the difference between two probability distributions (i.e., the loss of information when one distribution is used to approximate another). The KL divergence is thus defined as
\begin{align} \label{eq:KL} \DKLPQ{P}{Q}{\|} = \sumin \Xoi{P} \log \frakPQ{P}{Q} \end{align}with $P$ and $Q$ being two probability distribution functions and $n$ the number of sample points. Since $\DKLPQ{P}{Q}{\|}$ is not equal to $\DKLPQ{Q}{P}{\|}$, a symmetric variation of the KL divergence can be derived as follows:
\begin{align} \label{eq:KL2} \DKLPQ{P}{Q}{,} = \sumin \Big(\Xoi{P} \log \frakPQ{P}{Q} + \Xoi{Q} \log \frakPQ{Q}{P} \Big). \end{align}Columns B_block
Left
∩tionsetup{justification=justified,width=.85\linewidth}
Right
∩tionsetup{justification=justified,width=.85\linewidth}
Conclusions B_block
- This little example is meant to show how versatile org-mode is
- Scientific posters can be produced with a simple text editor